Buying a home in Greater Boston in 2026 is one of the most consequential financial decisions a person can make, and the neighborhood you choose will shape your equity growth, daily lifestyle, commute quality, school access, and long term wealth more than almost any other factor. Boston is not a single market. It is a constellation of micro-markets, each with its own demand dynamics, buyer profiles, appreciation trajectories, and risk profiles. A home in East Boston and a home in Back Bay may sit only two miles apart, but they represent entirely different investment theses. Understanding those differences is the starting point for every smart homebuying decision in 2026.
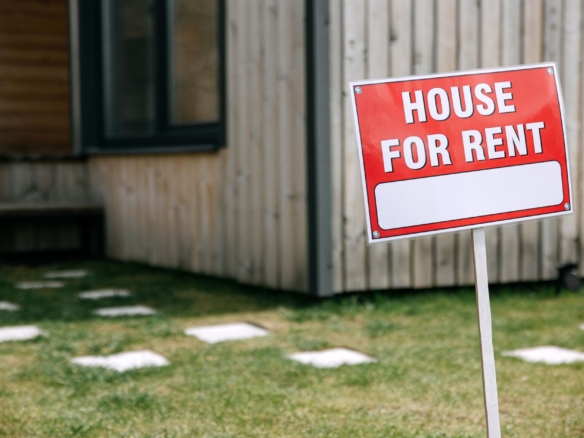
Get Pre-Approved Before You Start Your Boston Home Search
In Greater Boston the best homes go fast. Compare mortgage rates from 300+ lenders and get pre-approved so you can move the moment you find the right neighborhood.
Boston Renter Intelligence Survey
You are exactly who this is for.
We are building Boston's first independent renter intelligence report from real tenant data, not listing-site estimates. Add your numbers and get the Q3 report free when it publishes October 7.
Take the 2-minute survey →This guide is built for buyers who want to make data-informed decisions across the full spectrum of Greater Boston neighborhoods. Whether you are a first-time buyer stretching to afford your first property, a growing family looking for schools and space, or an investor seeking long-term appreciation with manageable entry costs, the right neighborhood exists for you in this market. The key is knowing where to look, what signals to follow, and how to move quickly without overpaying. To benchmark your research across every area covered in this guide, visit Boston Housing Data for the most current inventory, median price, and demand metrics available for the Greater Boston market.
Why Neighborhood Selection Is the Most Important Decision in Boston Homebuying
In most real estate markets, buyers are told that price and timing are the two critical variables. In Boston, neighborhood selection outranks both. The reason is structural. Greater Boston has extremely limited land, constrained new construction, and one of the most educated, high-income buyer pools in the country. Those conditions create persistent demand in certain neighborhoods and stagnant conditions in others, often separated by nothing more than a few blocks or a single T line.
Buyers who chose East Boston over Winthrop five years ago saw dramatically different appreciation curves. Buyers who chose Jamaica Plain over Hyde Park got different school options, walkability scores, and resale liquidity. These are not marginal differences. They are life-altering financial outcomes that compound over a 10-year or 20-year ownership horizon. Before you tour a single home, spend serious time comparing neighborhoods using tools like the Boston Neighborhood Finder, which allows you to filter by budget, lifestyle priorities, transit access, and school performance.
The Homzora B-NDI: How to Use the Boston Neighborhood Demand Index to Compare Areas
Homzora Realty developed the B-NDI, the Boston Neighborhood Demand Index, to give buyers a single composite score that captures the real-time and forward-looking demand conditions of each neighborhood. The index pulls from listing velocity, days on market, price-to-list ratios, buyer inquiry volume, and long-term appreciation trends to generate a score from 0 to 100. The higher the score, the more competitive the market and the stronger the structural demand that supports long-term appreciation.
In 2026, Cambridge leads all Greater Boston neighborhoods with a B-NDI score of 94, reflecting its extraordinary combination of institutional employment anchors, walkability, transit access, and persistent undersupply. Somerville, South Boston, and Jamaica Plain cluster in the 80s, while East Boston and Roslindale are rising fast through the 70s. Dorchester and Allston sit in the mid to upper 60s, representing value opportunity with upward momentum. Hyde Park and Mattapan remain in the 50s, signaling earlier stage appreciation cycles with more patient return profiles.
Using the B-NDI as a filter helps buyers avoid two common traps. The first is overpaying in a neighborhood that feels hot but is nearing peak demand saturation. The second is underbuying in a neighborhood with a rising score that has not yet translated fully into median price appreciation. The sweet spot in 2026 is neighborhoods with B-NDI scores in the 68 to 78 range and a clear upward trajectory over the past 24 months.
East Boston: The Top Value Play in Greater Boston for 2026
East Boston continues to be the most compelling value opportunity in all of Greater Boston heading into 2026. With median single-family and condo prices still running 35 to 45 percent below comparable properties in South Boston and the South End, East Boston offers Blue Line access to downtown in under 10 minutes, a rapidly developing waterfront corridor, and a buyer community that has transformed the neighborhood’s commercial and cultural energy over the past eight years.
The key driver of East Boston’s ongoing appreciation is infrastructure investment. The East Boston Waterfront District continues to attract mixed-use development, and the Sumner Tunnel renovation project, while disruptive during construction, will ultimately improve connectivity and make the neighborhood more accessible for commuters. New restaurants, coffee shops, and independent retail along Bennington Street and in Maverick Square have accelerated the lifestyle upgrade that follows transit-adjacent, affordable neighborhoods in major cities.
For buyers entering with down payment constraints, the FHA Loan Program remains one of the most effective ways to access East Boston properties with as little as 3.5 percent down, particularly for two-family homes where rental income from a second unit can offset a significant portion of the monthly mortgage payment. East Boston has more two and three family housing stock than almost any other inner-ring neighborhood, making it ideal for buyers who want to house-hack their way into appreciating Boston real estate.
East Boston Five-Year Appreciation Projection
Based on current inventory constraints, buyer demand trends, and the ongoing Waterfront District development pipeline, Homzora projects East Boston median prices will appreciate between 28 and 36 percent over the next five years, outperforming the Greater Boston median appreciation projection of approximately 18 to 22 percent over the same period.
South Boston: What Appreciation Is Left and Where to Find It
South Boston has been one of the dominant appreciation stories in American urban real estate over the past two decades. The neighborhood’s transformation from a working-class enclave to a premium urban lifestyle destination is largely complete, which means buyers in 2026 are entering at near-peak lifestyle premium pricing. That does not mean South Boston is a bad buy. It means buyers need to be strategic about what they are purchasing and why.
Homzora Proprietary Data
Boston Neighborhood Demand Index Q2 2026
- Cambridge: 94 (highest demand)
- South Boston: 91
- Back Bay: 89
- East Boston: 84 (fastest rising)
- Jamaica Plain: 78
- Dorchester: 71
The best remaining value within South Boston exists in the Andrew Square corridor and along the Old Colony Avenue stretch, where prices have not fully caught up with the premium commanded by properties closer to the waterfront and Fort Point. Condos in the Andrew Square area are still running 10 to 15 percent below comparable units at the northern end of the neighborhood, and the ongoing development pressure from the Seaport District is working southward in a way that should continue to compress that gap.
Buyers entering South Boston in 2026 should prioritize properties with parking, outdoor space, or strong rental income potential, as these are the features that protect value in a high-priced market. The B-NDI for South Boston sits at 83, confirming strong demand but also signaling that competition will remain intense and that overpaying at offer is a real risk for buyers who do not have clear comparable data.
Jamaica Plain: The Best Neighborhood for Families and Cultural Buyers
Jamaica Plain occupies a unique position in the Greater Boston market. It offers a combination of green space, cultural diversity, independent commercial corridors, and strong school options that no other neighborhood in the city replicates at the same price point. The neighbourhood’s B-NDI of 81 reflects both the depth of buyer demand and the scarcity of available inventory, particularly for single-family and larger condo units that appeal to growing families.
Arborway, Centre Street, and the areas surrounding Jamaica Pond continue to command premiums even within the neighbourhood. Buyers who stretch to purchase near the pond or along the Emerald Necklace frontage consistently see stronger appreciation and faster resale cycles than those who purchase further from the green space anchors. For families, the access to Boston’s open space network, combined with proximity to strong elementary options and the Orange Line, makes Jamaica Plain one of the most defensible long-term holds in the entire Greater Boston portfolio.
First-time buyers entering Jamaica Plain should assess their credit profile carefully before applying. Tools like SmartCredit allow buyers to monitor their credit scores in real time and identify opportunities to optimize their score before submitting mortgage applications, which can meaningfully improve loan terms in a high-price market like Jamaica Plain where even a quarter-point improvement in rate translates to tens of thousands of dollars over the life of a loan.
Dorchester: Space, Value, and Significant Upside
Dorchester is the largest neighborhood in Boston by land area, and its scale creates meaningful internal variation. Buyers who approach Dorchester as a monolith miss the distinction between neighborhoods like Savin Hill, which has already appreciated substantially and commands near-South Boston prices, and areas like Grove Hall or Codman Square, which remain at 2018-era price levels relative to the broader market.
Are You a Licensed MA Real Estate Agent?
List your Boston rentals and properties free on Homzora. Zero fees. Zero commissions. Direct leads sent to you.
The Savin Hill and Fields Corner corridors benefit from direct Red Line access, which is one of the most powerful appreciation drivers in all of Greater Boston. Properties within a half-mile walk of a Red or Green Line stop consistently outperform non-transit properties by 12 to 18 percent over five-year periods, according to Boston Housing Data analysis. Dorchester’s multiple Red Line stops create multiple investment zones within the neighborhood, each at a different stage of the appreciation cycle.
Buyers who purchase a home in Dorchester and want to protect their investment should consider a home warranty product. Choice Home Warranty offers comprehensive coverage for major systems and appliances, which is particularly valuable when purchasing older triple-decker stock that is common throughout Dorchester and can carry significant deferred maintenance risk.
Roslindale: The Hidden Gem of Greater Boston in 2026
Roslindale may be the single most underappreciated neighbourhood in Greater Boston heading into 2026. The neighbourhood offers an increasingly vibrant village center, strong housing stock including single-family homes with yards, competitive elementary school options, and access to the Needham Line commuter rail for buyers who commute south or west. Yet median prices remain 25 to 30 percent below Jamaica Plain, which borders it to the north.
The B-NDI for Roslindale has risen from 61 to 74 over the past 18 months, one of the steepest trajectory increases in the entire index. That momentum reflects a fundamental shift in buyer awareness. Roslindale is no longer the choice of buyers who could not afford Jamaica Plain. It is becoming the intentional first choice of buyers who prioritize space, community character, and the long-term appreciation narrative that comes with being the next neighbourhood to benefit from spillover demand from higher-priced adjacent areas.
Five-year appreciation projections for Roslindale sit at 24 to 32 percent, making it one of the top three appreciation opportunities in Greater Boston for buyers entering in 2026.
Cambridge and Somerville: Long-Term Value Retention at Premium Entry Points
Cambridge leads all Greater Boston neighborhoods with a B-NDI of 94, and for good reason. The concentration of MIT, Harvard, Kendall Square’s biotech and tech economy, world-class transit access, and a globally recognized name creates a demand floor that protects prices even during broader market corrections. Buyers who enter Cambridge are not chasing appreciation. They are buying durability, liquidity, and the most reliable long-term store of real estate value in the entire metro area.
Somerville has undergone a transformation comparable in scope to what South Boston experienced a decade earlier. The Green Line Extension brought new transit infrastructure to Union Square and Gilman Square, and the resulting development activity has fundamentally repositioned Somerville as a premium urban neighborhood with a B-NDI of 86. The challenge for buyers in both Cambridge and Somerville is price. Median prices in Cambridge frequently exceed one million dollars for condos, and even entry-level units in Somerville routinely trade above 650,000 dollars.
Buyers pursuing Cambridge or Somerville properties should compare financing options carefully. Compare Mortgage Rates across multiple lenders to ensure you are accessing the most competitive terms available for your credit profile and loan size, as the difference between lenders on a 900,000 dollar loan can be substantial over a 30-year amortization period.
Allston and Brighton: The Best Entry Point for First-Time Buyers
Allston and Brighton remain the most accessible inner-ring neighborhoods for first-time buyers in Greater Boston, and their long-term appreciation profile is far stronger than their reputation as student rental districts might suggest. The Washington Street corridor and the area surrounding Packard’s Corner have seen sustained investment from buyers who recognized that the combination of Green Line access, Harvard and BC adjacency, and compressed entry prices created a compelling ownership opportunity.
Brighton specifically offers more single-family and larger condo inventory than Allston, with a slightly quieter street-level character that appeals to buyers transitioning out of renting. The B-NDI for Allston and Brighton combined sits at 69, suggesting real upside potential as demand continues to move outward from the core. For buyers whose credit profile needs work before qualifying for optimal mortgage terms, resources like Tradeline Supply Company can help improve credit positioning before entering the mortgage application process.
What Transit Access Does to Home Values in Boston
No single variable has a more consistent and measurable impact on Boston home values than proximity to rapid transit. Properties within a half-mile walk of a Red, Orange, Green, or Blue Line station command a premium of 12 to 22 percent over otherwise comparable properties in the same neighborhood. That premium is not static. It grows over time as Boston’s population density increases and car ownership becomes less central to urban lifestyle.
The practical implication for buyers is that transit proximity is one of the safest ways to build structural appreciation protection into a purchase. Even in neighborhoods with lower B-NDI scores, transit-adjacent properties tend to perform better during market softening and recover faster during expansions. When evaluating any property in Greater Boston, map walking distance to the nearest T stop as one of your first research steps.
School District Impact on Boston Home Prices
Boston operates under a controlled choice school assignment system, which means that school access is not strictly determined by address in the same way it is in many suburban communities. However, the perception of school quality by neighborhood still has a meaningful impact on buyer demand and pricing. Neighborhoods associated with strong elementary school options, including West Roxbury, Roslindale, and parts of Jamaica Plain, consistently see more family buyer activity and stronger price retention during market cooling periods.
For buyers with school-age children, researching the Boston Public Schools assignment process thoroughly before committing to a neighborhood is essential. The relationship between address and school assignment in Boston is complex and changes periodically, so relying on informal neighborhood reputation rather than current assignment data is a risk that can produce significant disappointment after purchase.
Which Neighborhoods Have the Most New Construction in 2026
New construction activity in Greater Boston is heavily concentrated in a handful of corridors. East Boston’s Waterfront District, Dorchester’s Glover’s Corner area, the Fenway, and Somerville’s Union Square are producing the most significant new inventory in 2026. New construction provides benefits including modern systems, energy efficiency, and builder warranties, but it also tends to carry a price premium of 15 to 25 percent over comparable resale properties and can introduce condo fee risk in new developments with under-funded reserves.
Buyers considering new construction should weigh the efficiency and warranty benefits against the premium carefully. In a market like East Boston or Glover’s Corner, where the neighbourhood trajectory is strongly upward, that premium may be justified. In a market already near demand saturation, paying a new construction premium concentrates risk at the top of a pricing cycle.
How to Buy inStay Ahead of the Boston Market
Monthly insights on Boston rents, home tips, and investment opportunities delivered free to your inbox.
Stay Ahead of the Boston Market
Monthly insights on Boston rents, home tips, and investment opportunities delivered free to your inbox.
Related Boston Housing Resources