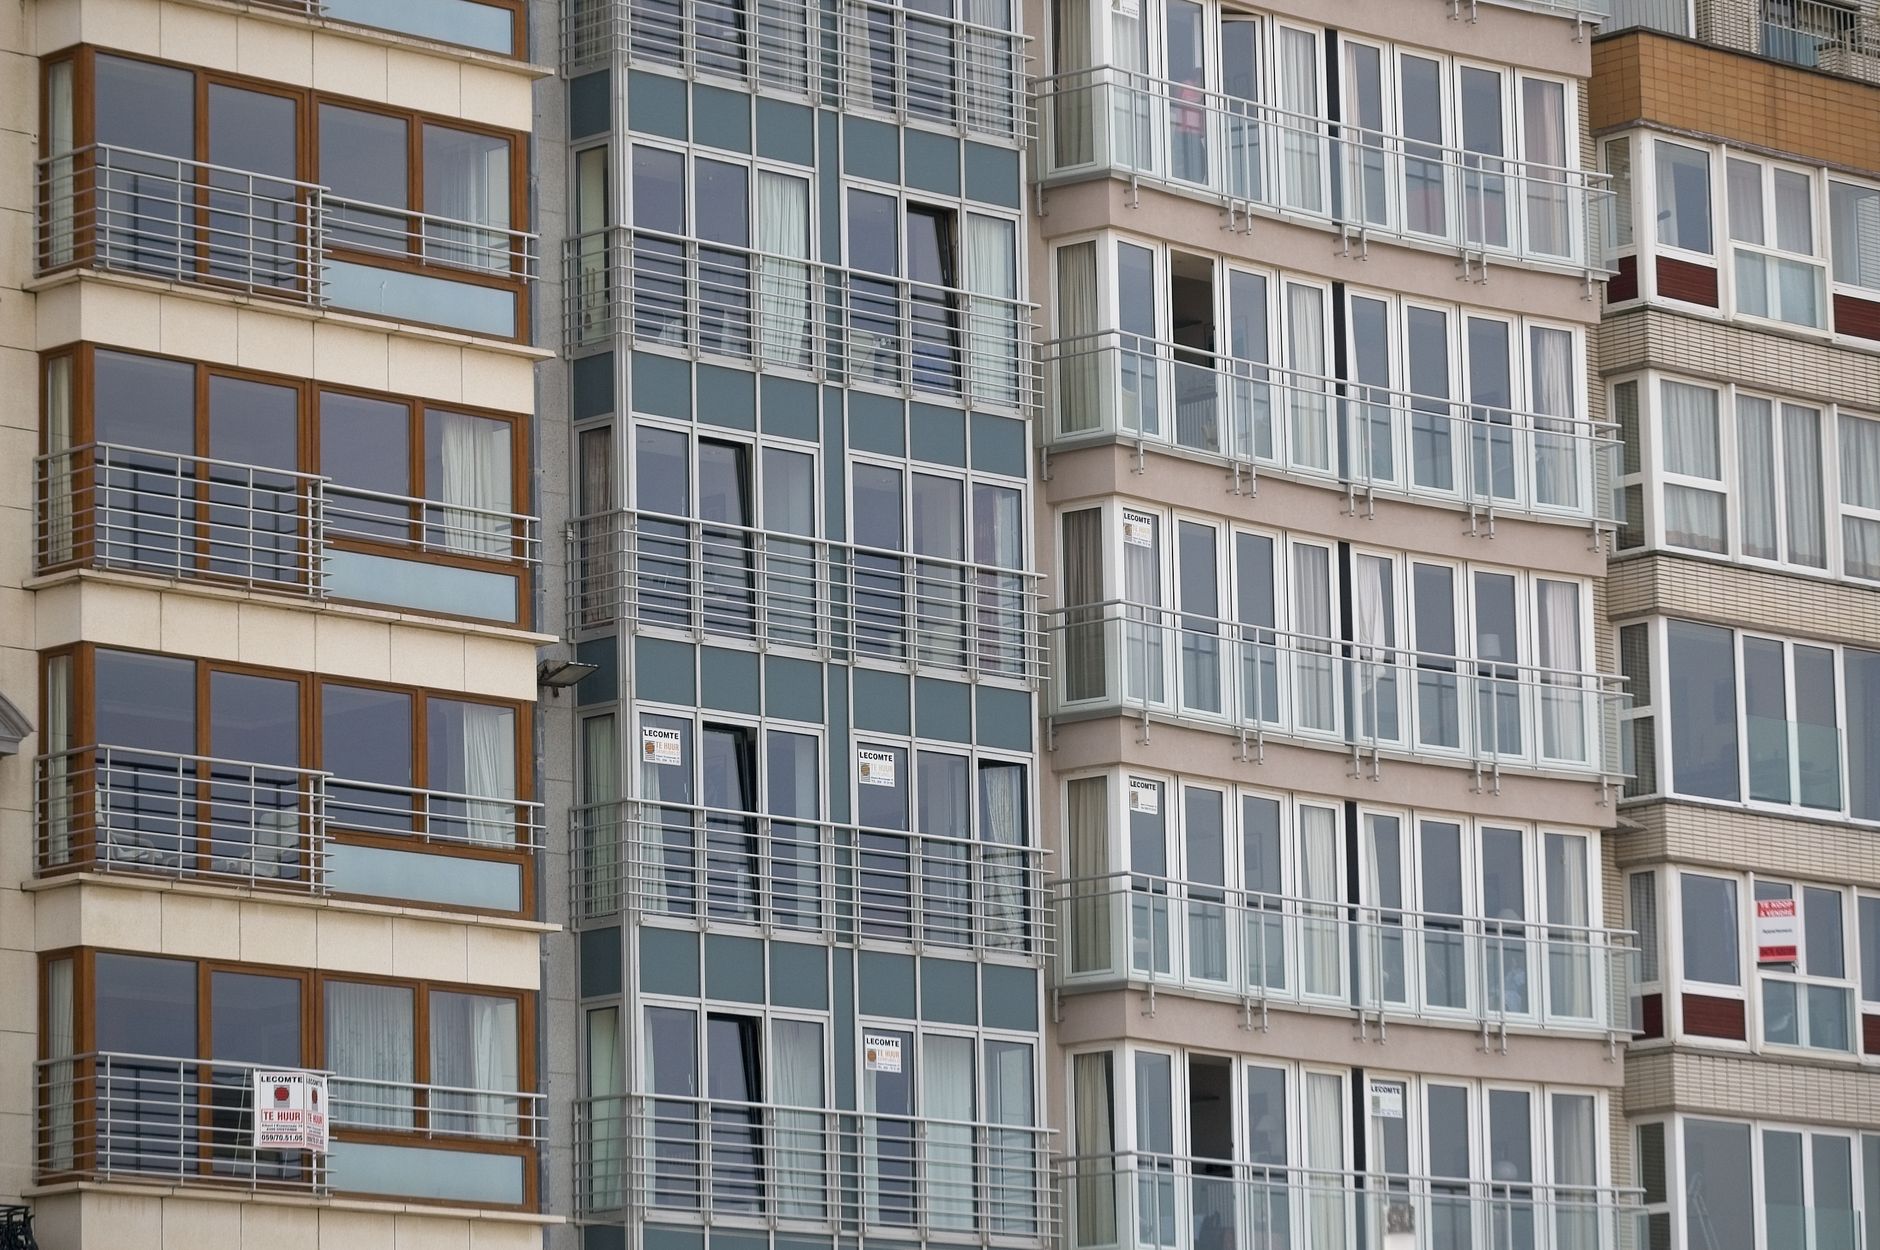
Rent figures are most useful in context, and the most useful context is change over time. A single snapshot tells you what something costs. A comparison tells you where the market is heading. This review looks at how Greater Boston’s rental market shifted over the year heading into mid-2026, what moved, what held steady, and what the direction of travel suggests for renters navigating their next lease. It also marks a deliberate starting point for the historical record Homzora will build as our data accumulates quarter over quarter, creating a reliable archive that renters, landlords, and analysts can return to as conditions evolve.
Boston Renter Intelligence Survey
How does your rent compare?
Add your numbers and get an instant read on what share of your income goes to rent, measured against what Boston renters actually report. You will also get the Q3 report free on October 7.
See how your rent compares →The Headline: A Market Loosening at the Edges
The clearest shift over the past year is a market that has loosened modestly from the extreme tightness of recent years, without becoming anything like a renter’s market. Independent data from Boston Pads shows the citywide median time on market lengthening to around 24 days in early 2026, roughly five days slower than a year earlier. Vacancy rates are projected to rise above three percent by the September cycle, the highest level since the pandemic disrupted normal leasing patterns. These are not dramatic movements, but their direction matters enormously. For the first time in several years, the small shifts point toward the renter rather than the landlord. Apartments are sitting a little longer, and there are marginally more of them available at any given moment.
Context matters here. Boston’s rental market spent the better part of three years in a state of historic tightness, with vacancy rates hovering near one percent in the most desirable neighborhoods and renters regularly competing against multiple applicants for a single unit. That environment produced some of the most aggressive rent growth the city had seen in decades. The current loosening does not erase those gains, but it does represent a meaningful change in the negotiating dynamic between renters and landlords. Where landlords once held virtually all the leverage, renters in some submarkets are beginning to find a small amount of room to push back.
If you are trying to understand where your budget fits into the current market, the Boston Rent Affordability Calculator is a useful starting point. It lets you input your income and target neighborhoods to see how your situation compares to actual asking rents across the city.
The Broker Fee Change: The Biggest Shift Nobody Talks About Enough
The single most consequential change for renters over the past year was not a price movement at all. It was a legal one. Last year’s broker fee legislation reshaped who pays the broker commission, and the effect has been substantial. Roughly three quarters of landlords now cover that fee in some form, a dramatic shift from a year earlier when renters routinely paid a full month’s rent in broker fees on top of first month, last month, and a security deposit. For renters, this has meaningfully reduced the upfront cash required to sign a lease, even in cases where the headline monthly rent has not fallen at all. The real, all-in cost of moving into a Boston apartment dropped for many renters, which is a genuine improvement that the rent figures alone do not capture.
What the Broker Fee Shift Means in Dollars
The practical scale of the broker fee change is worth spelling out carefully, because it is easy to understate when you are only looking at monthly rent figures. On a $2,800 apartment, a full-month broker fee paid by the renter added $2,800 to the upfront cost of moving in, layered on top of first month, last month, and a security deposit that could bring the total to well over $10,000 before getting the keys. That kind of cash barrier effectively locked out a large share of working renters from units they could otherwise afford on a monthly basis.
Shifting that broker fee to the landlord removes one of the most significant structural barriers to moving in Boston’s rental market. Even where the fee is partially passed back through slightly higher monthly rent, spreading a cost across twelve monthly payments is far easier to manage than paying it all upfront on a single transaction. A $200 annual increase spread over twelve months is a very different financial reality than $2,800 due at signing. This is the kind of structural change that affects real-world affordability more than any modest movement in median rent, and renters who have not moved in the last two years may not fully appreciate just how different the upfront experience now is.
Before signing any lease in the current environment, it is worth reviewing your agreement carefully. A well-structured LawDepot Lease Agreement can help both renters and landlords understand exactly what obligations are being agreed to, including how fees and deposits are structured and what protections exist for both parties.
What Held Steady: The Demand Hierarchy
Even as the market loosened at the margins, the underlying hierarchy of demand across Boston’s neighborhoods remained largely intact. The neighborhoods that commanded premium rents a year ago still command them today, and the gap between the most and least expensive parts of the city did not close in any meaningful way. Back Bay, the South End, and the Seaport continued to attract tenants willing to pay for location, finishes, and access to employment centers. Beacon Hill and Cambridge’s core neighborhoods remained exceptionally competitive despite the broader loosening, with well-priced units still drawing multiple applications within days of listing.
The neighborhoods that showed the most meaningful softening were the secondary and tertiary rings, areas like parts of Dorchester, Mattapan, Hyde Park, and some sections of East Boston where rents had been pushed to historically high levels by spillover demand from pricier neighborhoods. In these areas, the loosening was more pronounced, with time on market extending further and some landlords offering concessions they would not have considered eighteen months ago. For renters who have flexibility on location, this tier of the market represented some of the better value in the city during the past year.
Understanding which neighborhoods fit your budget and lifestyle is worth doing carefully. The Boston Neighborhood Finder is a practical tool for comparing neighborhoods across multiple dimensions, including commute options, walkability, and typical rent ranges, so you can make a more informed decision about where to focus your search.
Rent Levels Across Unit Types
Studios and One-Bedrooms
Studio apartments in Boston proper held relatively firm over the past year, with citywide medians remaining in the $2,100 to $2,400 range depending on neighborhood and building vintage. The smallest units benefited from a consistent pool of demand from young professionals and graduate students who prioritize location over space. In neighborhoods with strong proximity to universities and hospitals, studio rents showed almost no downward movement at all.
One-bedroom apartments told a slightly more nuanced story. In premium neighborhoods, one-bedroom rents largely held their ground. In the outer neighborhoods and some transitional areas, there was modest softening, with median asking rents declining by roughly two to four percent from their peak. That is not a dramatic correction, but it represents real money over the course of a year and reflects the fact that renters in this segment had slightly more room to negotiate than in recent cycles.
Two-Bedrooms and Larger Units
Two-bedroom apartments are the workhorse unit of the Boston rental market, and they showed the most interesting dynamics over the past year. Roommate-share demand remained strong, keeping prices elevated in areas with good transit access. However, larger units, three-bedrooms and four-bedrooms aimed at student groups and extended roommate households, showed more variability. Some landlords in traditionally student-heavy neighborhoods like Allston and Brighton reported slower fill rates than in previous years, a function of both slightly lower enrollment numbers and the simple reality that more units have come to market in those areas over the past eighteen months.
New Construction and Its Effect on Supply
One of the underappreciated drivers of the current loosening is the pipeline of new apartment construction that has been delivering units to the Boston market over the past two years. Several large multifamily projects in the Seaport, South Boston, and parts of the inner suburbs came online over this period, adding thousands of units to a market that had been severely undersupplied for years. These new units tend to be concentrated at the higher end of the price range, but their effect ripples through the broader market. When upper-tier renters have more choices, some of them make moves that create vacancies in older, more modestly priced buildings, adding supply across the spectrum.
Are You a Licensed MA Real Estate Agent?
List your Boston rentals and properties free on Homzora. Zero fees. Zero commissions. Direct leads sent to you.
This construction pipeline is unlikely to continue at the same pace. Rising construction costs, higher interest rates, and a complicated permitting environment in Boston have slowed new project starts. That means the supply relief currently being felt in parts of the market may be temporary, and the medium-term outlook for renters is for conditions to tighten again as demand continues to grow and new supply slows.
The Financial Side of Renting in Boston Today
Credit and Qualification Standards
One area where the market loosening has not translated into meaningful relief is landlord qualification standards. Boston landlords, particularly in professionally managed buildings and in high-demand neighborhoods, have maintained or tightened their income and credit requirements over the past year. The standard income requirement of 40 times the monthly rent remains firmly in place across most of the market, meaning a renter applying for a $2,500 apartment typically needs verifiable income of $100,000 per year. Credit score thresholds have similarly held firm, with many landlords looking for scores of 680 or higher as a baseline.
The True Cost of Renting in Boston
Monthly rent is only one part of the total cost of renting in Boston, and it pays to think through the full picture before committing to a unit. Utilities in older Boston triple-deckers can add several hundred dollars per month to your housing costs, particularly in winter. Renter’s insurance, while not legally required in Massachusetts, is strongly recommended and typically costs between $15 and $30 per month for a reasonable level of coverage. Parking, if you own a car, adds another $150 to $300 per month in most neighborhoods. Pet fees, where applicable, can add meaningful upfront and ongoing costs.
The September Cycle: What to Expect
Boston’s rental market is defined by its September cycle in a way that few other American cities are. The concentration of universities, medical schools, and graduate programs in the region creates an annual demand surge that overwhelms normal market dynamics every summer. The majority of leases in the city start on September 1, which means the spring and early summer months represent the period when most of the market’s annual transactions occur. Understanding this cycle is essential for any renter trying to time their search strategically.
For the 2026 September cycle, the current indications point to a market that is somewhat more favorable to renters than the previous two cycles, but still far from easy. The projected vacancy rate above three percent is an improvement from recent years, but three percent is still historically low. Renters who identify their target neighborhoods early, have their financial documents organized, and understand what landlords are looking for will be at a significant advantage over renters who wait until July to begin their search.
Looking Ahead: What the Direction of Travel Suggests
Reading the Boston rental market is always an exercise in holding two things in mind simultaneously. In the short term, conditions are modestly more favorable for renters than they have been in several years. Time on market is longer, vacancy is rising slightly, the broker fee burden has shifted, and some landlords are showing more flexibility than they were eighteen months ago. These are real improvements.
In the medium term, the structural dynamics that have made Boston one of the most expensive rental markets in the country remain very much in place. Demand is driven by a concentration of education, healthcare, and technology employment that shows no sign of diminishing. The permitting and construction environment continues to constrain new supply. The demographic pipeline of young professionals moving to the city is robust. These factors suggest that the current loosening is a temporary moderation rather than the beginning of a sustained correction.
For renters, the practical implication is that the window of marginally better conditions is worth taking advantage of if you are planning a move or a renewal negotiation. Landlords in many parts of the market are more open to conversation than they were a year ago, and renters who come to the table prepared and informed can extract better terms than they could have in the tight market of 2023 and 2024.
Staying informed with current data is the best tool available to renters operating in this market. The more you know about what comparable units are actually renting for, how long they are sitting, and what the trends in your target neighborhood look like, the better positioned you are to make smart decisions. For current data, neighborhood breakdowns, and trend tracking across Greater Boston, visit Boston Housing Data at Homzora to access the most up to date figures and historical comparisons as our data archive continues to grow quarter over quarter.
Stay Ahead of the Boston Market
Monthly insights on Boston rents, home tips, and investment opportunities delivered free to your inbox.
Related Boston Housing Resources