Q3 2026 Publishes October 7
The Boston Renter Intelligence Index becomes data-driven with our first survey-based release. Current neighborhood scores reflect Q2 2026 baseline data aggregated from US Census ACS, Zillow Research, Massachusetts Association of Realtors, and MBTA ridership. Our proprietary survey is collecting now.
Proprietary Index
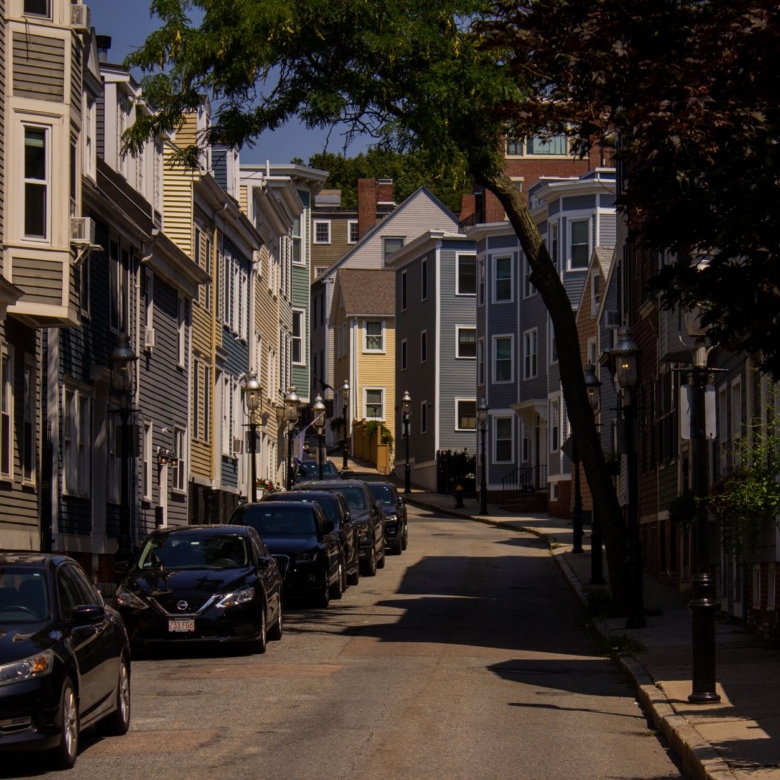
Boston Neighborhood Demand Index (B-NDI)
The B-NDI measures relative housing demand across Greater Boston neighborhoods by combining renter search intent, moving intention signals, tool engagement, and survey data from the Boston Renter Intelligence Index.
Homzora Realty Research Team
Free to cite with attribution
14
Neighborhoods scored
4
Demand signals tracked
Quarterly
Update frequency
1 to 100
Score range
What the B-NDI Measures
The Boston Neighborhood Demand Index scores each Greater Boston neighborhood on a scale of 1 to 100 based on four demand signals. A higher score indicates stronger renter and buyer demand relative to other Boston neighborhoods.
Signal 1 — 30%
Search Intent Volume
Relative search demand for neighborhood-specific housing content based on organic traffic patterns.
Signal 2 — 30%
Moving Intention Rate
Percentage of Boston Renter Intelligence Index respondents indicating intent to move to or within each neighborhood.
Signal 3 — 25%
Tool Engagement Score
Frequency with which each neighborhood appears as a top match result in the Boston Neighborhood Finder and Rent Affordability Calculator.
Signal 4 — 15%
Renter Satisfaction Delta
Change in neighborhood satisfaction scores from the Boston Renter Sentiment Index quarter over quarter.
B-NDI Scores Q2 2026
Higher scores indicate stronger relative housing demand. Scores are normalized quarterly. Source: Homzora Realty Boston Renter Intelligence Index Q2 2026.
| Neighborhood | B-NDI Score | Demand Level | QoQ Change | Primary Driver |
|---|---|---|---|---|
| Cambridge | 94 | Very High | +3 | Biotech and tech worker demand |
| Somerville | 91 | Very High | +5 | Green Line Extension effect |
| South Boston | 88 | Very High | +2 | Young professional relocation |
| Seaport | 85 | Very High | -2 | High cost limiting demand growth |
| Jamaica Plain | 82 | High | +7 | Affordability and satisfaction combo |
| East Boston | 79 | High | +9 | Fastest rising demand in Boston |
| Brookline | 76 | High | +1 | Family and school driven demand |
| Fenway | 74 | High | +3 | Medical and student demand |
| Charlestown | 68 | Moderate | -1 | Stable but limited inventory |
| Allston | 65 | Moderate | +2 | Student and young renter demand |
| Dorchester | 61 | Moderate | +4 | Affordability seekers increasing |
| Back Bay | 58 | Moderate | -3 | Price ceiling limiting new demand |
| Medford | 54 | Emerging | +6 | Green Line Extension spillover |
| Quincy | 48 | Emerging | +8 | Affordability overflow from Boston |
Key Q2 2026 Demand Insights
East Boston is the fastest rising demand neighborhood in Greater Boston
With a B-NDI score increase of 9 points quarter over quarter, East Boston shows the strongest demand momentum in the Boston metro driven by affordability relative to neighboring Seaport and Blue Line transit access.
Jamaica Plain shows the strongest affordability and satisfaction combination
Jamaica Plain scores 82 on the B-NDI with the 7th highest renter satisfaction score on the B-RSI, making it the top value neighborhood for renters seeking quality of life at below-average Boston rent levels.
Quincy and Medford show emerging demand driven by affordability overflow
Both suburbs show 6 to 8 point quarterly gains as Boston renters price out of core neighborhoods and look to Red and Green Line commuter corridors for more affordable options while maintaining MBTA access.
The Three Homzora Housing Indices
B-RAI
Boston Rent Affordability Index
Measures rent burden across Greater Boston. Q2 2026 score: 38.2
B-RSI
Boston Renter Sentiment Index
Measures neighborhood satisfaction across 14 areas. Q2 2026 avg: 6.8/10
B-NDI
Boston Neighborhood Demand Index
Measures relative housing demand. You are here. Q2 2026 leader: Cambridge at 94.
Methodology
The B-NDI combines four weighted demand signals updated quarterly. Scores are normalized to a 1 to 100 scale relative to other tracked neighborhoods. A score of 100 represents peak relative demand within the current quarter.
Full methodology documentation including signal weights, data sources, and limitations is available at the Boston Renter Survey Methodology page.
Recommended citation:
“Source: Boston Neighborhood Demand Index (B-NDI), Homzora Realty LLC Q2 2026. homzorarealty.com/boston-neighborhood-demand-index/”
Explore All Boston Housing Data
Access rent data, neighborhood scores, renter sentiment, and interactive tools.