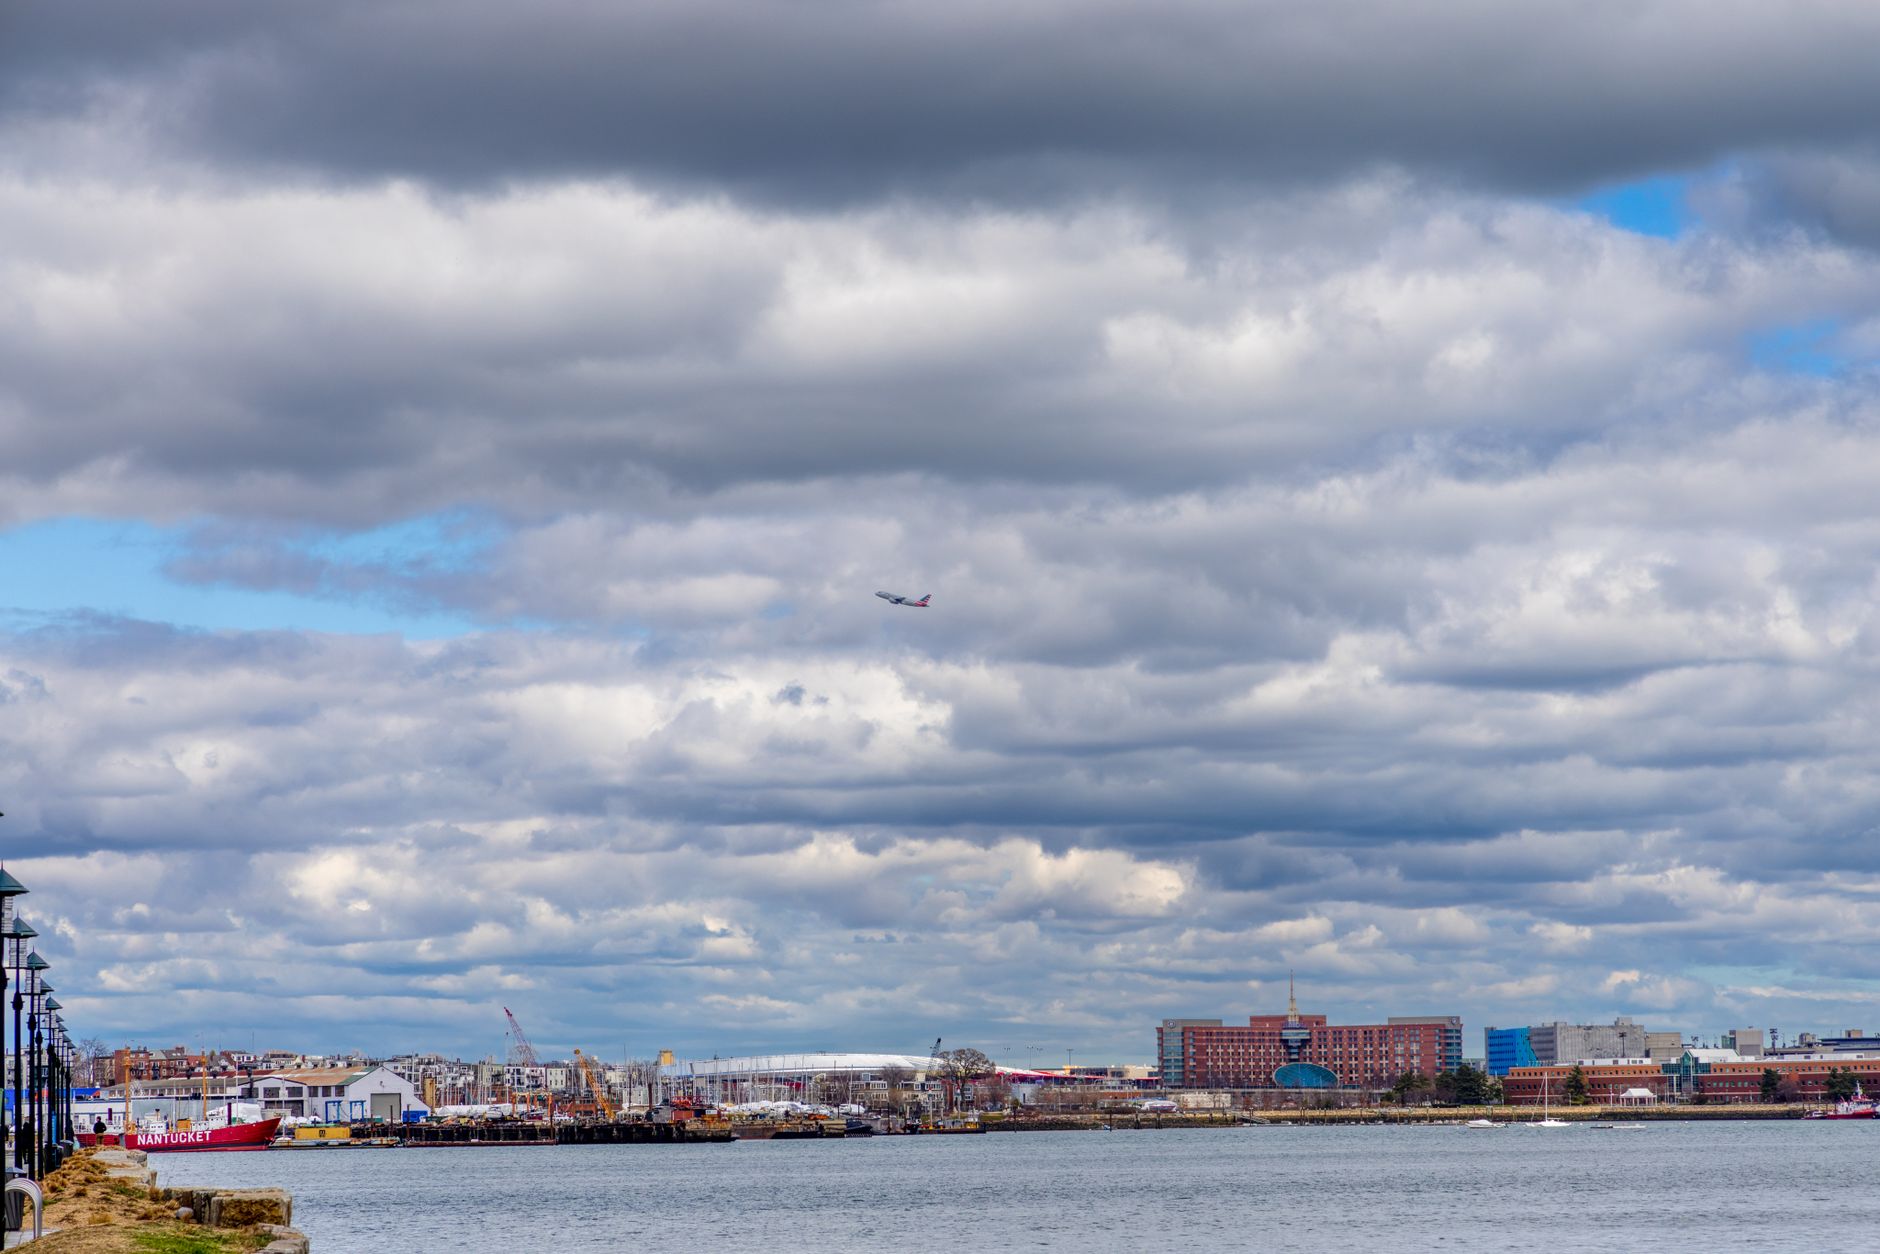
East Boston has quietly become one of the most talked about investment destinations in Greater Boston, and the investors paying attention in 2026 are positioning themselves ahead of what many analysts expect to be a significant price correction relative to surrounding neighborhoods. While South Boston, Charlestown, and the Seaport District have already seen their appreciation cycles mature, Eastie, as locals affectionately call it, still offers entry price points that feel like a different city entirely. This guide breaks down everything a serious investor needs to know before committing capital to this waterfront neighborhood that sits less than two miles from downtown Boston.
Why East Boston Is Undervalued Relative to Other Boston Neighborhoods
The price gap between East Boston and comparable Boston neighborhoods is one of the most striking anomalies in the current Boston real estate market. Median condo prices in East Boston hover around $520,000 as of early 2026, while comparable units in South Boston routinely trade above $750,000 and Charlestown condos regularly cross the $800,000 threshold. That gap represents a 30 to 50 percent discount for a neighborhood with direct Blue Line access, waterfront views, and a location that puts residents within ten minutes of downtown Boston by subway.
The Homzora B-NDI, which stands for the Boston Neighborhood Demand Index, currently scores East Boston at 71 out of 100, placing it firmly in the high demand growth category. This score reflects accelerating search traffic from buyers and renters, rising lease renewal rates in the neighborhood, and increasing numbers of out of neighborhood investors inquiring about multi family properties. The B-NDI score has climbed eight points in the past 18 months alone, signaling that the window of relative affordability may not remain open for much longer.
The historical perception of East Boston as a working class immigrant neighborhood has contributed to its relative undervaluation for decades. Stigma, combined with airport proximity and older housing stock, kept buyers focused elsewhere. But those same conditions have also preserved an authentic cultural fabric and a supply of triple decker properties that are increasingly rare in Boston and increasingly attractive to investors seeking strong cash flow.
Blue Line Transit Access and Proximity to Logan Airport
East Boston is served by four Blue Line stations, specifically Maverick, Airport, Wood Island, and Orient Heights, making it one of the most transit connected neighborhoods in Boston. The Blue Line connects directly to Government Center, State Street, and Bowdoin Station, delivering residents to the financial district and downtown core in under ten minutes. For renters who work in downtown Boston or the Seaport, East Boston offers a commute time that rivals or beats anything available in Jamaica Plain, Roslindale, or Hyde Park, all neighborhoods that command equal or higher prices.
Logan International Airport sits directly adjacent to East Boston, which creates both opportunity and risk for investors. On the opportunity side, the airport generates thousands of jobs and a constant stream of travelers who need short term accommodations. On the risk side, flight path noise affects certain streets and parts of the neighborhood more than others, a factor that must be weighed carefully before purchasing. We address noise zone mapping in greater detail later in this guide, but the key insight for investors is that properties east of Bremen Street and south of Bennington Street tend to experience heavier noise impacts, while areas like Orient Heights and Eagle Hill have substantially quieter conditions.
Waterfront Development and the Suffolk Downs Redevelopment Project
The two largest catalysts for East Boston appreciation in 2026 and beyond are the ongoing waterfront redevelopment along the harbor and the massive Suffolk Downs mixed use project that spans East Boston and Revere. Suffolk Downs, formerly a horse racing track, is being transformed into a 161 acre urban district that will eventually include approximately 10,000 residential units, 40 acres of open space, retail, life sciences space, and community facilities. The project is one of the largest urban development efforts in New England history.
For East Boston real estate investors, the Suffolk Downs project represents a neighborhood changing injection of new residents, new retail, and new employment within walking distance of existing properties. The Orient Heights station sits directly adjacent to the development site, meaning that early investors in the surrounding blocks are buying ahead of a wave of demand that has yet to materialize but has been approved, permitted, and partially under construction.
Along the harbor, the East Boston Greenway and various waterfront parcels have attracted restaurant operators, brew pubs, and water taxi connections to downtown that have transformed the visual identity of the neighborhood. The LoPresti Park waterfront area and the Jeffries Point sub neighborhood have seen some of the strongest appreciation in East Boston precisely because these waterfront lifestyle amenities have already arrived.
Current Median Home and Condo Prices Compared to South Boston and Charlestown
Understanding the price landscape is essential for any investor evaluating East Boston in 2026. The following comparison reflects current market conditions and helps frame the opportunity relative to competing neighborhoods.
- East Boston median condo price: approximately $520,000
- South Boston median condo price: approximately $755,000
- Charlestown median condo price: approximately $820,000
- East Boston median single family or triple decker price: approximately $850,000 to $1,100,000
- South Boston median single family price: approximately $1,200,000 to $1,500,000
The multi family price comparison is equally revealing. A three unit triple decker in East Boston that generates $6,000 to $7,500 per month in gross rents can often be acquired for $950,000 to $1,100,000. A comparable income producing property in South Boston, if one could even be found, would likely require $1,500,000 or more. This spread creates meaningfully better cap rates and cash on cash returns in East Boston, which is the core argument for investors focused on income rather than pure appreciation.
To explore current pricing across all Boston neighborhoods with interactive data tools, visit the Boston Housing Data resource at Homzora, which is updated regularly to reflect the latest transaction data from the Boston MLS.
Rental Demand and Cap Rate Analysis for Triple Deckers and Multi Family Properties
East Boston’s immigrant workforce population has historically created one of the most stable rental markets in the city. Vacancy rates in well maintained East Boston multi family properties have consistently run below 3 percent, and the neighborhood’s strong community bonds mean that tenants often stay for years rather than months. For investors, low turnover is a meaningful operating advantage that reduces carrying costs and management headaches.
Homzora Proprietary Data
Boston Neighborhood Demand Index Q2 2026
- Cambridge: 94 (highest demand in Greater Boston)
- South Boston: 91
- East Boston: 84 (fastest rising, undervalued relative to demand)
- Jamaica Plain: 78
Cap rates for East Boston multi family properties currently range from approximately 4.5 to 6.5 percent depending on property condition, exact location, and whether units are at market rent or subject to below market leases. This range compares favorably to South Boston and Charlestown, where cap rates for similar properties often fall below 3.5 percent, and it compares reasonably with outer neighborhoods like Hyde Park or Mattapan, where cap rates can reach 6 to 7 percent but appreciation potential is more limited.
Demographic Shift and Gentrification Trends
East Boston has long been home to one of the most vibrant Latino communities in New England, with a population that is approximately 60 percent Hispanic, predominantly of Central American and South American origin. This community has built deep roots over several decades and contributes significantly to the cultural character of the neighborhood through restaurants, markets, and community organizations along Meridian Street and other commercial corridors.
Gentrification pressures in East Boston are real and deserve honest acknowledgment. The arrival of higher income renters and buyers, drawn by transit access and waterfront proximity, has driven rents upward and displaced some longtime residents. For investors, this demographic transition creates appreciation potential, but it also creates community tension and potential political pressure for rent stabilization measures at the city level. Investors should monitor Boston city council policy developments closely.
The demographic shift is most visible in Jeffries Point, Eagle Hill, and areas near the waterfront, where new restaurants, coffee shops, and boutique retail have replaced older uses. Orient Heights has seen somewhat less displacement so far, partly due to its distance from the waterfront and partly due to stronger community organization. Investors targeting multi family income properties should approach the market with respect for the existing community and a willingness to be fair landlords, both as an ethical obligation and as a practical strategy for maintaining stable tenancies.
New Construction Pipeline and What It Means for Investors
Beyond Suffolk Downs, East Boston has a significant pipeline of new residential construction approved or under development. Several parcels along the waterfront and near the Maverick and Airport stations are in various stages of permitting or construction, with projects ranging from boutique condominium conversions to larger market rate apartment complexes. This new supply will add to the neighborhood’s population and retail support, but it will also create competition for existing rental properties in the short term.
Are You a Licensed MA Real Estate Agent?
List your Boston rentals and properties free on Homzora. Zero fees. Zero commissions. Direct leads sent to you.
Investors purchasing existing multi family properties should factor in the new supply when projecting occupancy and rent growth. The general expectation among market analysts is that demand growth from Suffolk Downs and continued in migration will absorb new supply over the medium term, but a two to three year period of elevated vacancy pressure in certain sub markets is a realistic scenario that should be stress tested in any acquisition underwriting.
Flood Zone and Climate Resilience Considerations for Waterfront Property
East Boston’s waterfront location is one of its greatest assets and one of its most significant risks. A substantial portion of the neighborhood sits within FEMA designated flood zones, particularly in the Jeffries Point area, around the harbor edges, and in low lying sections near the Chelsea Creek. For investors, this has two primary financial implications: flood insurance costs and long term climate resilience uncertainty.
Flood insurance for properties in FEMA Zone AE or VE can add $2,000 to $8,000 or more annually to operating costs depending on the structure type, elevation, and coverage amount. These costs must be included in any realistic cash flow analysis. Investors should require flood elevation certificates on any East Boston property before committing to purchase, and they should consult with an independent insurance broker rather than relying solely on seller provided figures.
The City of Boston has invested in climate resilience planning for East Boston through the Climate Ready East Boston initiative, which includes flood wall planning, green infrastructure, and zoning changes designed to reduce the neighborhood’s vulnerability to sea level rise and storm surge. These public investments will take years to fully implement, but they signal a long term commitment to the neighborhood that should provide some comfort to investors with longer time horizons.
Property Tax Rates and Investment Math
Boston’s property tax rate for residential properties is among the lowest of any major American city as a percentage of assessed value, a significant advantage for real estate investors. The fiscal year 2026 residential tax rate in Boston is approximately $10.50 per $1,000 of assessed value, meaning that a property assessed at $900,000 would carry an annual tax bill of approximately $9,450. For multi family properties classified as commercial, the rate is higher, so investors should verify the tax classification of any specific property before completing their financial analysis.
Boston’s residential exemption program, which reduces the assessed value of an owner occupied property by a fixed amount, can provide meaningful savings for house hackers who live in one unit of a multi family property. This is another reason the house hacking strategy is financially compelling in East Boston specifically.
Best Streets and Sub Areas Within East Boston for Investment
East Boston is not a monolithic neighborhood. Different sub areas have distinct investment profiles, and understanding these differences is essential to making smart acquisition decisions. The Boston Neighborhood Finder tool at Homzora can help investors map specific blocks and compare sub area characteristics interactively.
Jeffries Point
Jeffries Point is the most gentrified and waterfront oriented sub area in East Boston. Prices here are the highest within the neighborhood, but so is the quality of the rental demand and the pace of appreciation. Condos on Jeffries Street, Cottage Street, and nearby blocks attract young professionals who value harbor views and water taxi access. Investors here are buying for appreciation more than cash flow.
Eagle Hill
Eagle Hill offers a blend of affordability and access that makes it attractive for multi family investors focused on cash flow. Streets like Leyden Street, Marion Street, and Saratoga Street have active sales markets and rental demand that reflects both the established community and newer arrivals. Triple deckers here represent some of the most attractive income property opportunities in the neighborhood.
Orient Heights
Orient Heights, anchored by its own Blue Line station, is the most affordable and least gentrified of the major East Boston sub areas. This is where value investors looking to buy ahead of the next wave of appreciation should be focusing their attention. The proximity to the Suffolk Downs development site is the key long term catalyst, and properties near the Orient Heights station could see substantial appreciation as that project delivers its early phases.
Maverick Square and the Core
The area around Maverick Square is the commercial and transit hub of the neighborhood. Investment properties here benefit from maximum transit convenience and strong rental demand, but availability is limited and prices reflect the premium location. Mixed use properties with ground floor commercial and upper floor residential units can be particularly strong performers in this sub area.
How to Finance an East Boston Investment Property
For owner occupants purchasing a two to four unit property, the FHA loan pathway offers the most accessible financing structure available. First time investors are often surprised to learn that FHA allows purchase of multi family properties as long as the borrower occupies one unit, and the low down payment requirement makes it possible to enter the Boston multi family market with substantially less capital than a conventional investment loan would require.
East Boston Appreciation Forecast Compared to Citywide Average
Most Boston real estate analysts project citywide appreciation in the 3 to 5 percent annual range for 2026 and 2027, reflecting tight inventory, continued demand from the education and life sciences sectors, and limited new supply relative to
Stay Ahead of the Boston Market
Monthly insights on Boston rents, home tips, and investment opportunities delivered free to your inbox.
Related Boston Housing Resources